Welcome to our Snapshot of the European Economies. As with our U.S. Economic Snapshot we present the salient features of the business cycle in Europe in a way that we find informative. In this post we compare recovery paths of the major European economies as they try to rebound from the recession that began in 2008. This is the most pressing issue facing European policy makers, central bankers and other economies around the world. In subsequent posts we will look at labor markets in Europe, and we will present more detailed comparisons across business cycles for individual economies. In the page referred to in the heading above we discuss the problems of identifying European business cycles given the data limitations. One of the remarkable features of the current economic contraction that began in 2008 is the extent to which the initial collapse was common across economies (including the U.S.) in both timing and severity. What is not common is the path of recovery as the following analysis shows.
The Gap Grows In Europe
The figure below shows the available consistent time series for real GDP that are maintained by Eurostat. The short length of some of the series indicates why within country cross-cycle comparisons are challenging. But the data make clear that the timing of the current cycle is common to all. The peak occurred in the first quarter of 2008 and the trough of the contraction was in the second quarter of 2009.

Following the contraction, Europe has been a tale of haves and have-nots. The following graph plots the percentage change in Real GDP for several EU countries from the peak of the previous business cycle. It underscores how different the recovery has been for many of the economies. For instance, Germany experienced one of the most severe contractions with real GDP falling more than 6% from the peak. The German recession was just as severe as that in Italy or the U.K. Subsequently, Germany has had a robust recovery while Italy and the U.K. both have recovered very little and both are again in decline. Spain is on the verge of falling below its previous trough. France and the Netherlands did not contract as much as the other countries and initially showed signs of a V shaped recovery. In recent months they too have faltered as the problems of Europe weigh on their economies.

It is worth comparing the U.S. recovery to the recovery in Europe. In the figure below the U.S. is depicted in the heavy blue line. U.S. GDP did not fall as much as in Germany or the U.K. or Italy but the recovery has been similar to the German recovery.

Looking at the recoveries from the trough shows much the same message. Spain continued to contract a bit after 2009 Q2 and only Germany has had a robust recovery.

Consumption has collapsed badly in many of these economies as has capital formation. The following figures show that consumption has recovered only in France and Germany and that capital formation has not attained its previous peak in any of the economies. Even more dramatic is the decline in residential capital formation. The total collapse in Spain is well understood but except for Germany it is remarkably weak everywhere.


One of the few bits of encouraging data is the recovery of exports in several of the most impacted economies. Spain in particular has had robust export growth as have Germany and the Netherlands. Imports have recovered in Germany the Netherlands and France.


The Role of Government
The Great Recession that began in 2008 had a common trigger in the paralysis of the world financial system caused by the build up of systemically risky debt on the balance sheets of financial institutions and the enormous cross border flows of risky debt. But the proximate circumstances of countries varied a lot. Some, like Spain, the U.S. and Ireland had collapsing housing bubbles and a massive build up of private debt. Others, like Italy, the U.K., and Greece had large outstanding stocks of government debt. The initial response of the governments was quite different. The figure below shows the response as measured by the percentage change in government consumption from the peak of the cycle to the present. This essentially captures the level of Government spending.
The percentage change in government spending measured as a percent of GDP is depicted below the levels. This reflects both the level of government consumption and the decline in GDP.
Finally, we plot the change in government indebtedness in response to the crisis.


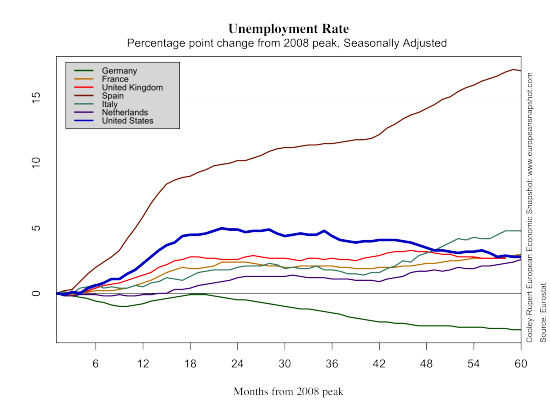
 Despite contracting output across the Eurozone economies, there are no signs of (increased) turmoil in labor markets. The unemployment rate for Germany, Italy, and the UK maintained a slow downward trend. Spain’s unemployment rate decreased for the first time since the peak of the cycle. France and the Netherlands maintained a slow upward trend.